
Reports
Reports give you a clear view of how your store is performing — how much you've sold, what profit you've made, and where your money is coming from and going.
Sales Report
The Sales Report shows you total revenue broken down by day, product, category, or cashier — depending on your filters.
- Date range — filter by today, this week, this month, or a custom range.
- By product — see which items sell the most units and generate the most revenue.
- By category — identify your best-performing product groups.
- By payment method — see how much was paid by cash vs. card vs. mobile money.
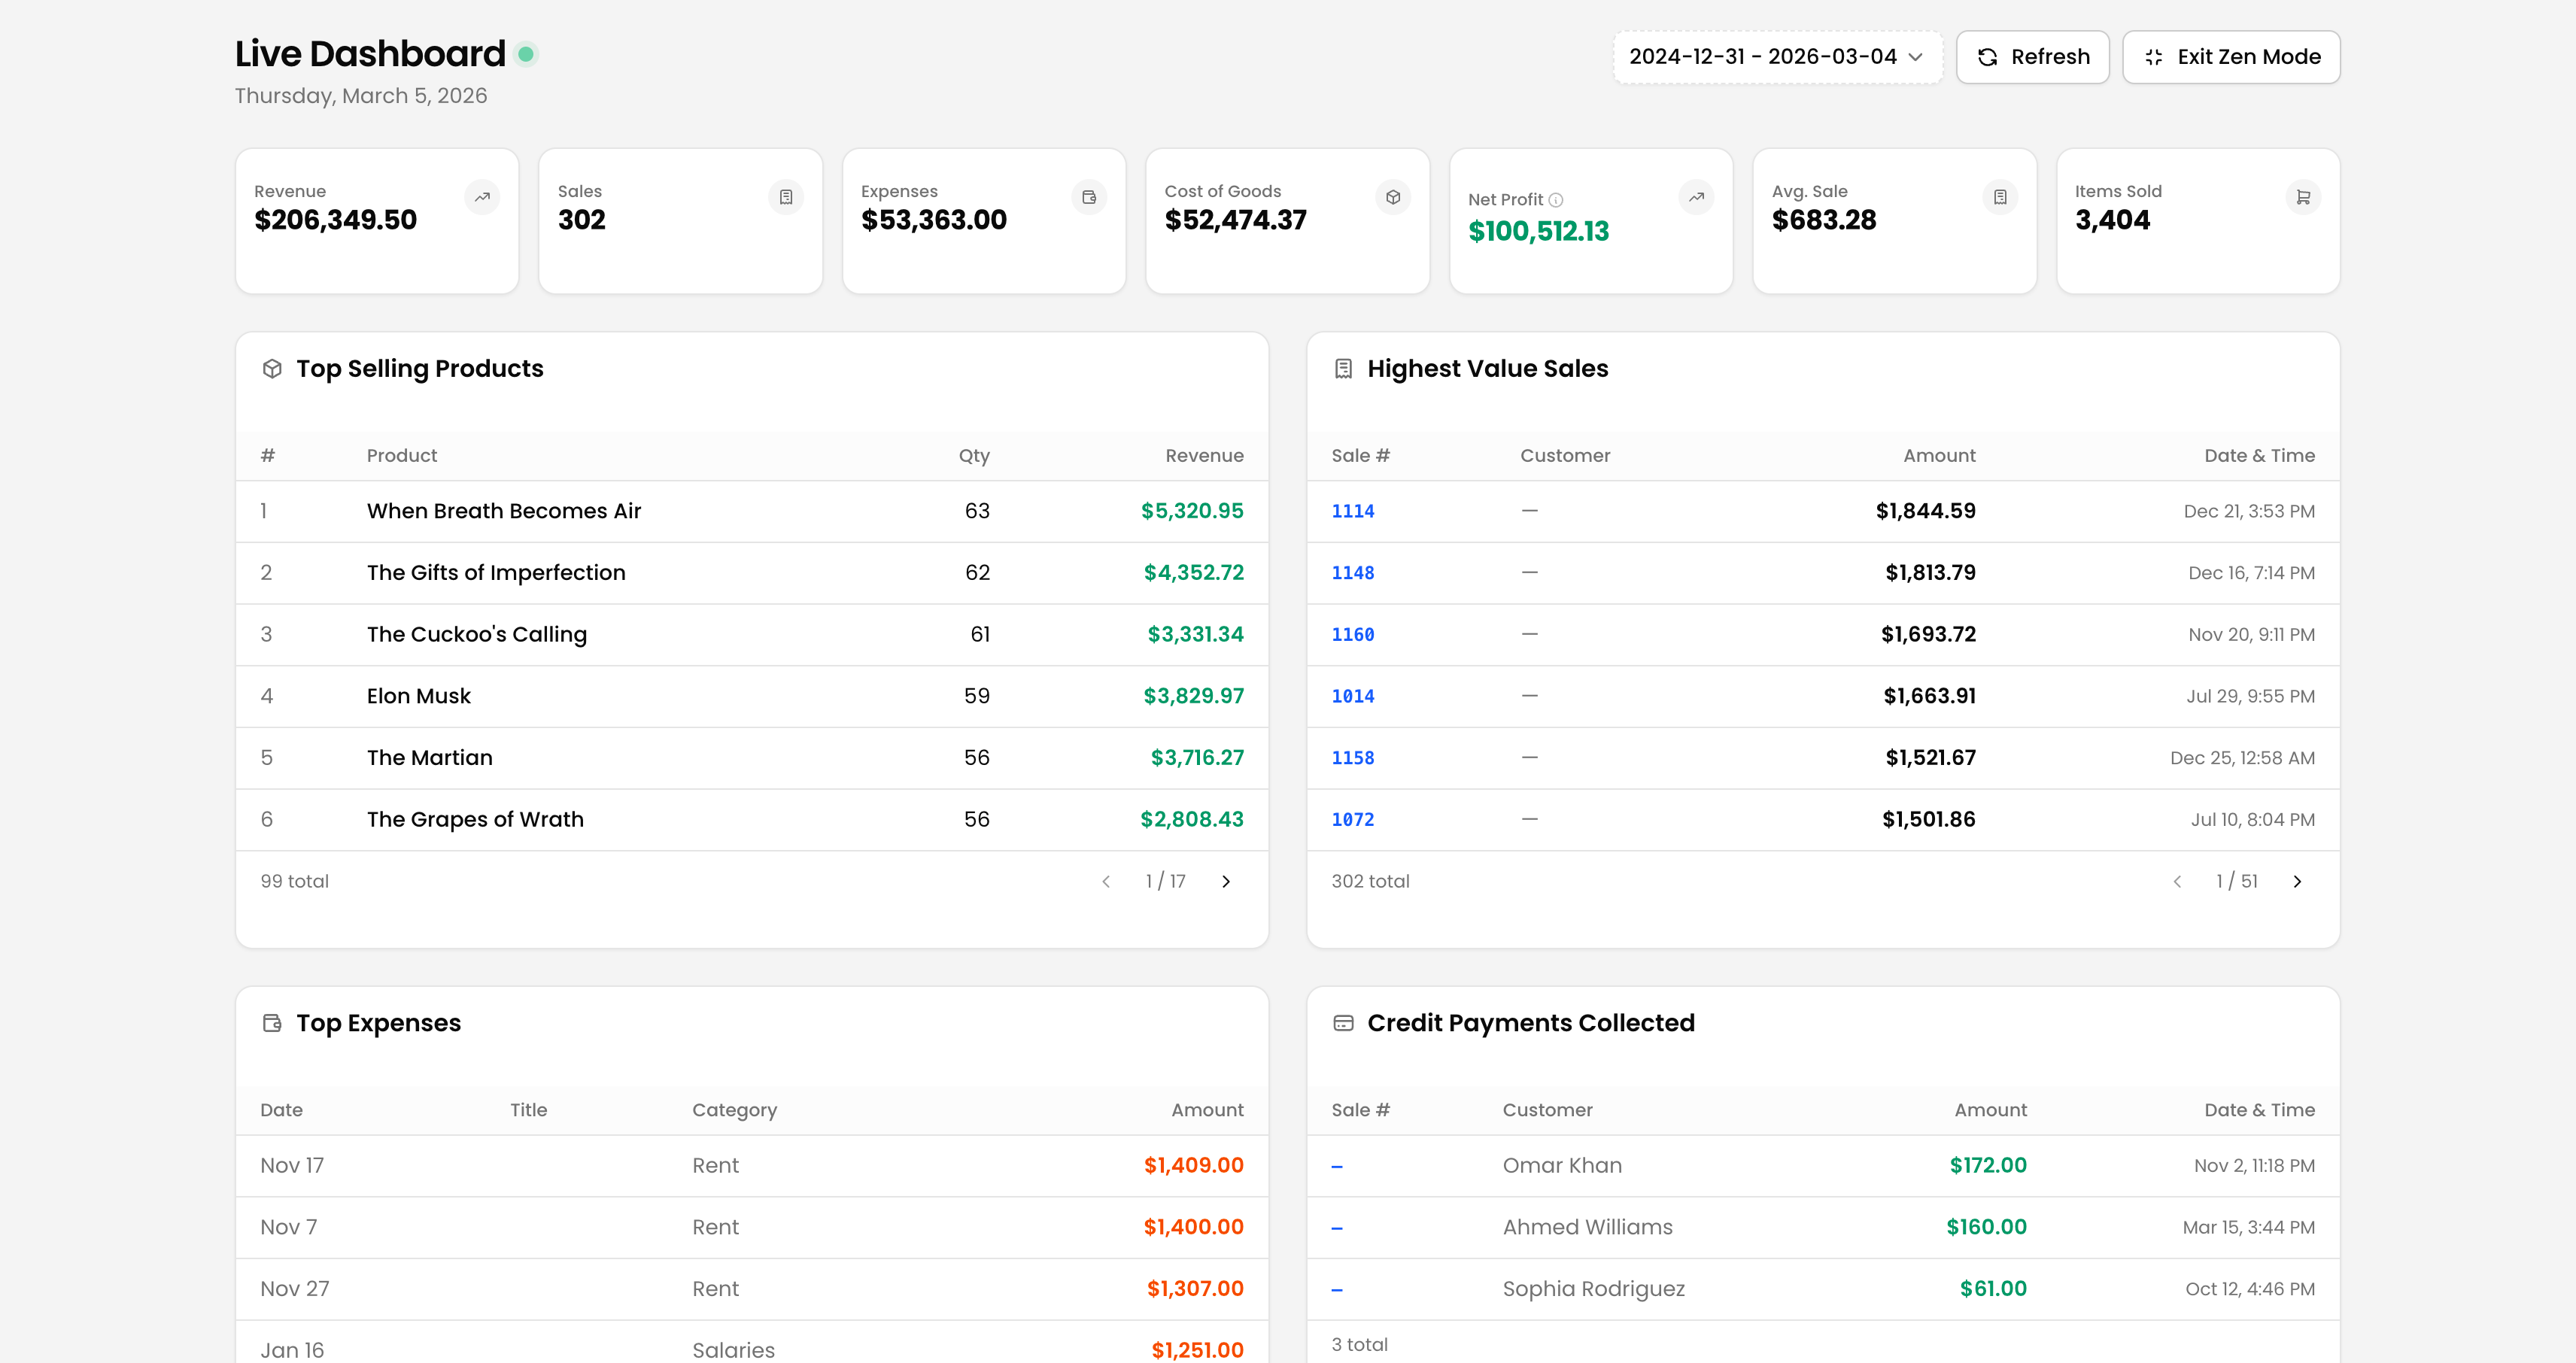 The Sales Report — filter by date range and drill down by product or category.
Profit Report
The Profit Report calculates your gross profit (revenue minus cost of goods) and net profit (gross profit minus expenses) for any period.
| Metric | How it is calculated |
|---|---|
| Revenue | Total sale price of all completed sales in the period. |
| Cost of Goods | Sum of the cost prices of all products sold. |
| Gross Profit | Revenue − Cost of Goods. |
| Total Expenses | Sum of all expenses recorded in the same period. |
| Net Profit | Gross Profit − Total Expenses. |
For accurate net profit figures, make sure you record all your expenses — not just cost of goods. Rent, salaries, and utilities all affect your true profit.
Export a Report
Any report can be exported as a CSV or PDF for sharing, filing, or importing into accounting software.
- 1Open the report you want to export (Sales, Profit, etc.).
- 2Apply your desired date range and filters.
- 3Click Export and choose CSV or PDF.
- 4The file downloads immediately — open it in Excel, Google Sheets, or a PDF viewer.
You've completed the Jiaflow Sales tutorial. If you have questions not covered here, reach out to our support team from the Contact page.